The sample of 119 patients with an average age of 44.84 years has completed two-year monitoring, showing that SEGOVA has a favourable effect on the endocrine status and the reproductive outcome of patients.
All patients had sonographic follow-ups for a period of two years from the procedure. The same group of 119 patients also monitored hormone levels of FSH, LH for a period of two years, while follow-up for E2, PG and AMH was followed successively. The study was conducted at the Special Gynecology Clinic – Jevremova Belgrade, Saint James Malta Hospital, Remedica Skopje Clinic, 2015-2020.
Preliminary laboratory analyses were performed in all patients and questionnaires were given about menstruation, parity, the presence of a POF diagnosis in family medical history, educational level, and possible sources of stress prior to amenorrhea. They were also given the quality of life questionnaires. Table 1. below represents the sterility type of patients.
| Sterilitas prim | 75 |
| Sterilitas sec | 42 |
| POF | 34 |
| Endometriosis | 10 |
| Endocrine disorders: | |
| Hashimoto | 8 |
| Hypothyreosis | 18 |
| Glucose intolerance | 17 |
Table 1. Sterility type
Our results show that the effects of the intervention on FSH levels could be seen already after 6 months when FSH starts declining, while the most pronounced reduction was achieved after 24 months (54.23%). The effects of the intervention on LH could be seen already after 6 months, when its concentration starts declining, while a decrease is the most pronounced at 24 months post-intervention (60.67%).
Graph 1 represents level of FSH and Graph 2 represents level of LH, at baseline, 6, 12 and 24 months after the program.
The rise in estradiol (E2) is the most pronounced at 18 months (53.54%). The increase in progesterone levels was recorded at 6 months post-intervention (29.73%). After 6 months, there was an increase in the level of AMH hormone (36.84%).
Graph 3 represents the level of E2 at baseline and 18 months after the program, Graph 4 represents level of PG and Graph 5 represents level of AMH, at baseline and 6 months after the program.
Graph 1
Graph 2
Graph 3
Graph 4
Graph 5
Table 2. represents the total results of ultrasonography for 105 patients that completed the two-year follow-up show during 24 months period after the re-transplantation:
| Patients No. | Follicles No. | Egg Cells No. | Embryos No. | Embryo transfer No. | Vitrified Embryos No. | Pregnancies No. | Live births No. |
| 105 | 485 | 175 | 94 | 26 | 19 | 10 | 6 |
| The number of patients with a positive result: | 77 | 33 | 26 embryo positive women | 12 women with ET | 12 women with vitrified embryos | 10 pregnant women | 5 women with live birth |
| The percentage of patients with a positive result: | 64.70% | 42.86% out of women who had follicles | 78.79% out of women who had eggs | 61.54% out of women who had embryos | 46.15% out of women who had embryos | 12.99% out of responding patients | 6.49% out of responding patients |
Table 2.
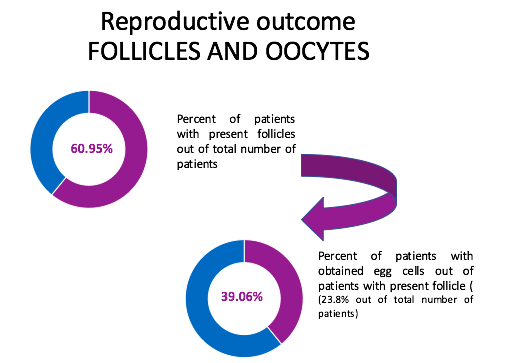
Follicles – 64.70% of patients had the presence of a follicle.
Oocytes – Attempts to perform oocyte retrieval resulted in aspirated oocytes in 42.86% follicle positive women.
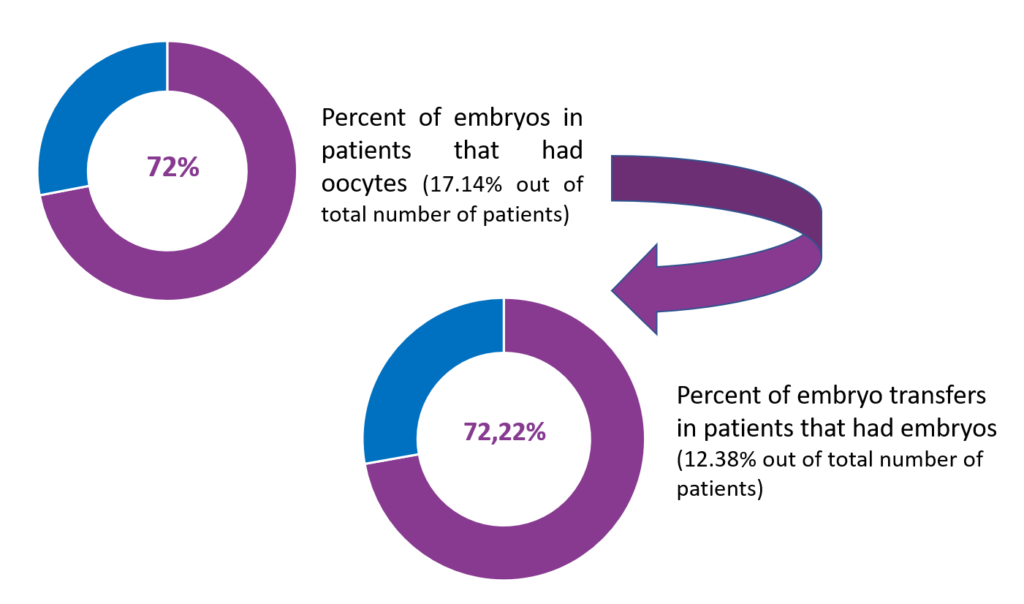
Fertilization – The fertilization rate of the aspirated oocytes was 78.79%, resulting in embryos.
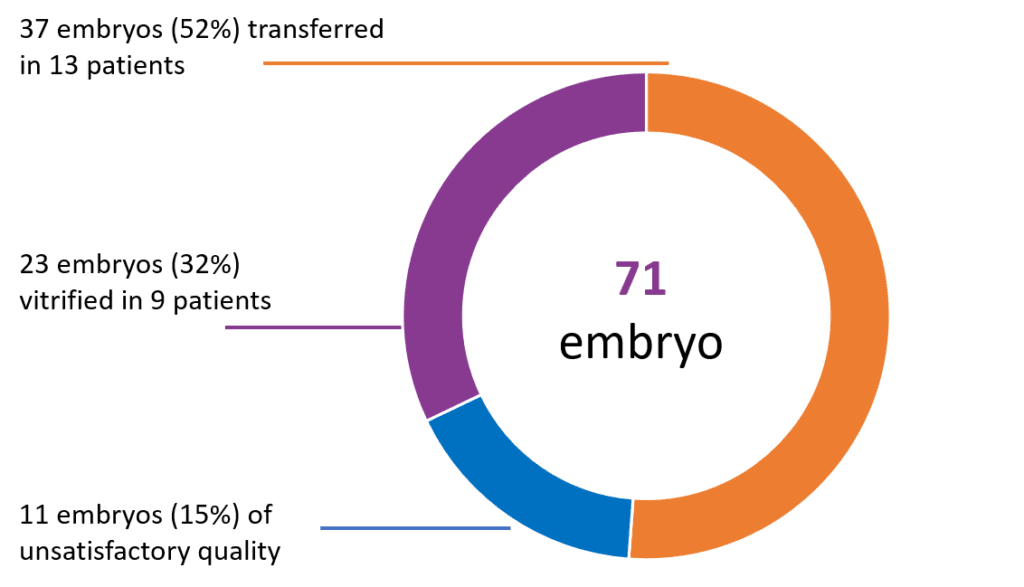
Embryos – Embryo transfers were performed in 61.54% embryo positive women, while 46.15% of embryo positive women had vitrified embryos.
Pregnancies – Ten pregnancies were achieved (12.99% of responding patients). Four patients spontaneously conceived after transplantation, while four pregnancies were conceived with IVF.
Two additional pregnancies were achieved with additional reproductive techniques. So far, out of total 10 pregnancies, 3 pregnancies ended with a missed miscarriage, one pregnancy was lost due to abnormal karyotype, while 5 pregnancies resulted in the successful birth of 6 newborns (one of them was twin pregnancy).
Graph 6 represents total number of embryos that our patients had.
Graph 7 represents number of follicles and oocytes.
Graph 8 represents number of embryos and embryo transfers.

Graph 6

Graph 7

Graph 8
