Besides the Segova program, our team is performing very successfully other specific fertility programs which you cannot find at other clinics. Below are listed some of the procedures we perform. Segova is most advanced of them and it is related to patients with many failed IVFs, early menopause and ovarian failure. Others procedures (napisati koje budu navedene dole) are specific and related to the implementation of the embryo, ……
We offer our patient to visit us and let us find the best solution for their individual case and to create a personalized program for them. This means that choosing the procedure depends on many factors such as age, hormonal status and many other analyses, previous attempts, etc.
Also, with the Segova or any other procedure, we could offer you a package of procedures tailored to you in order to get the best possible results.
Basic treatment results, specific treatment performed u okviru fertility treatmenta, koje one ne mogu da nadju nigde drugo.
Just to compare results with others, pgs, skrecing,
Success rate by age group 2019
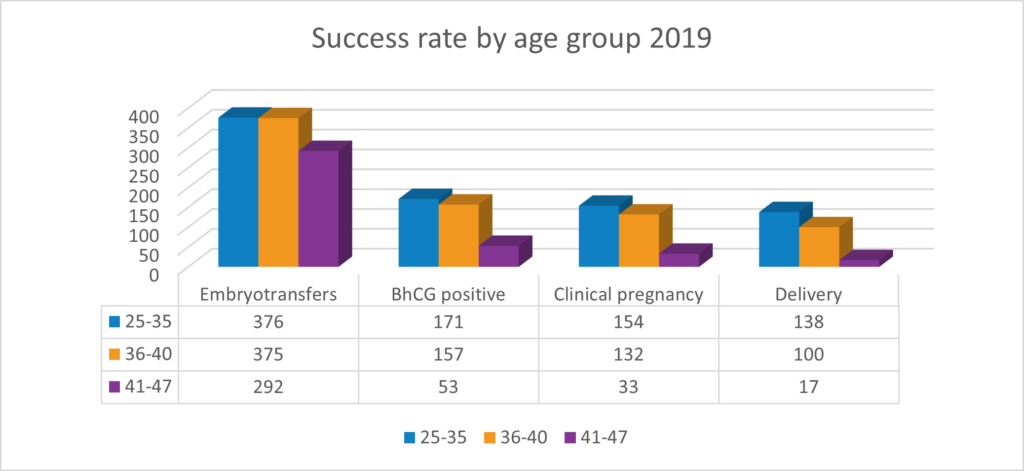
Chart 1 represents the success rate of stimulated cycles for three groups of patients with different age group and different infertility causes.
The first group represents patients in the age group of 25-35 yrs / 376 embryo transfers resulted in 171 positive pregnancy test, in which we have clinical pregnancy verification in 154 patients. Out of 154 patients, 138 of them delivered healthy babies.
The second group 36-40 yrs / 375 embryo transfers resulted in 157 positive pregnancy test. We had clinical pregnancy verification in 132 patients. Out of 132 patients, 100 babies were delivered.
Third group 41-47 yrs / 292 embryo transfers resulted in 53 positive pregnancy test, in which we have clinical pregnancy verification in 33 patients. Out of 33 patients, 17 babies were delivered.
Obtained cells and embryos by age group
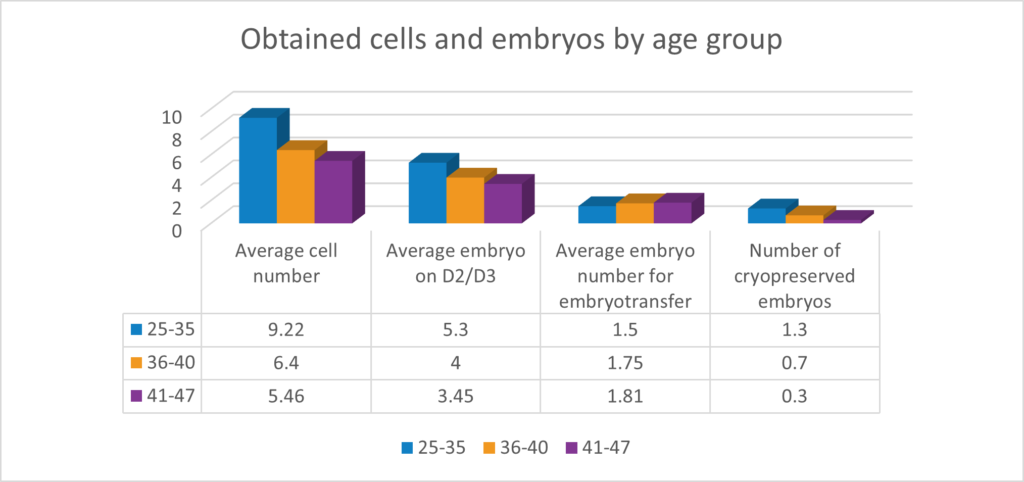
Chart 2 represent many obtained cells and living embryos during stimulated cycles for patients of three different age groups. The groups contain diverse infertility factors.
The first group 25-35 yrs / Average cell number retrieved in this group was 9.22 (average cell number contains all cells MI, MII, GV). On D2-D3 the average number of live embryos were 5.3, of which on D5 we have 1.5 per patient. The average number of cryopreserved embryos in this age group was 1.3.
The second group 36-40 yrs / Average cell number retrieved in this group was 6.4 (average cell number contains all cells MI, MII, GV). On D2-D3 the average number of live embryos were 4, of which on D5 we have 1.75 per patient. The average number of cryopreserved embryos in this age group was 0.7.
Third group 41-47 yrs / Average cell number retrieved in this group was 5.46 (average cell number contains all cells MI, MII, GV). On D2-D3 the average number of live embryos were 3.45, of which on D5 we have 1.81 per patient. The average number of cryopreserved embryos in this age group was 0.3.
Average age
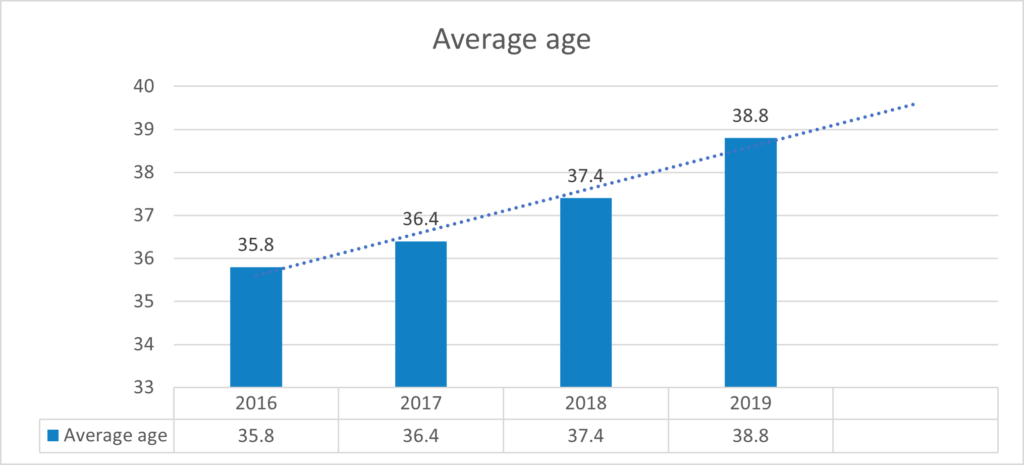
Our team monitored the average age in which we performed IVF cycles (both natural and stimulated), and as a result, we concluded that:
- in 2016 our average patient was 35.8 years old
- in 2017 was 36.4
- in 2018 was 37.4
- the average age in 2019 was 38.8.
These are an average age of all our patients during 12 months monitoring regardless of the infertility cause.
Success rate by age group 2019
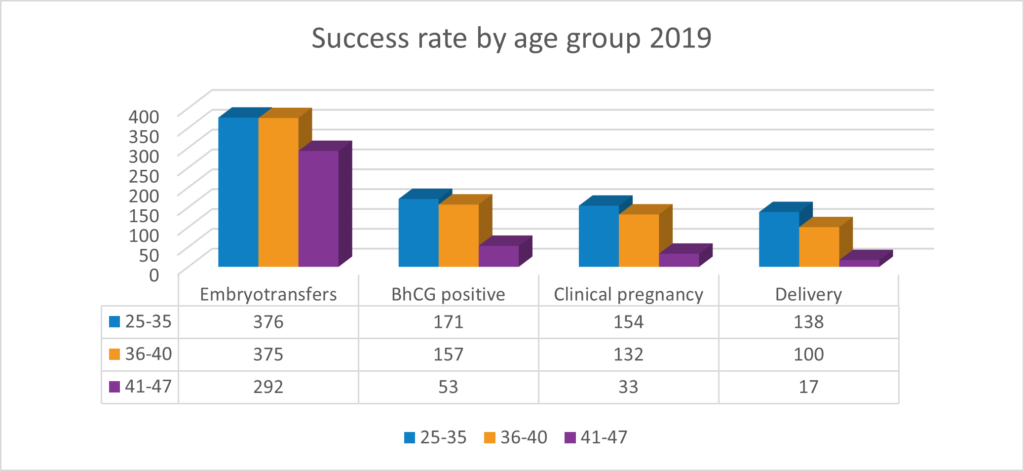
In this chart, we have listed the success rate of stimulated cycles for three age groups of patients with different infertility causes.
First group 25-35yrs / 376 embryo transfers resulted in 171 positive pregnancy test, in which we have clinical pregnancy verification in 154 patients. Out of 154 patients, 138 of them delivered healthy babies.
Second group 36-40yrs / 375 embryo transfers resulted in 157 positive pregnancy test. We had clinical pregnancy verification in 132 patients. Out of 132 patients, 100 babies were delivered.
Third group 41-47yrs/ 292 embryo transfers resulted in 53 positive pregnancy test, in which we have clinical pregnancy verification in 33 patients. Out of 33 patients, 17 babies were delivered.
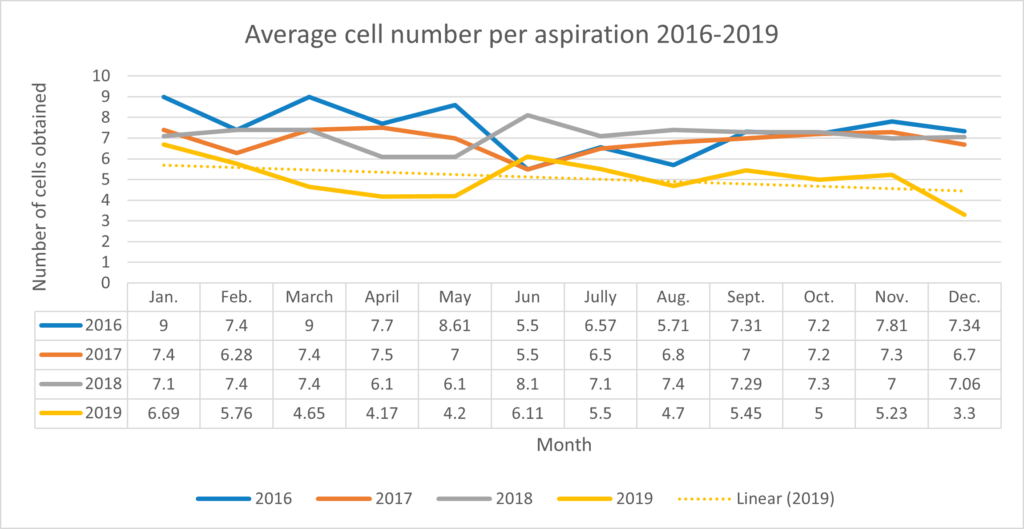
Average cell number per aspiration during one year
Graph 5 represents results during the course of 4 years follow up (2016-2019). We noted the relation related to an increase in the average age of the patient and a decrease in the number of retrieved cells. Also, on this graph, we see that the number of retrieved egg cells doesn’t vary depending on the month of the year – that is usually misconception.
